
Infrastructural Spheres

The Roman aqueduct system was an elaborate and complex water provision network composed of underground conduits, elevated channels, arcades, castella, and subterranean distribution pipes. As flow networks extending both horizontally and vertically in space, aqueducts formed the first three dimensional infrastructural spheres in the history of Western cities. With such spheres, the city was no longer a coplanar stratum with extruded structures throughout. Instead, it became a multilayered datum of visible and invisible flow networks that encompass streets and edifices from above and below. Yet, the most common approach in representing cities, namely maps and three dimensional models, does not capture nor convey the multilateralism of the multi-tiered, non-planar infrastructure sphere. This in turn emanates a partial reading of the city, concealing the very same sphere that is critical to its existence and dynamism.
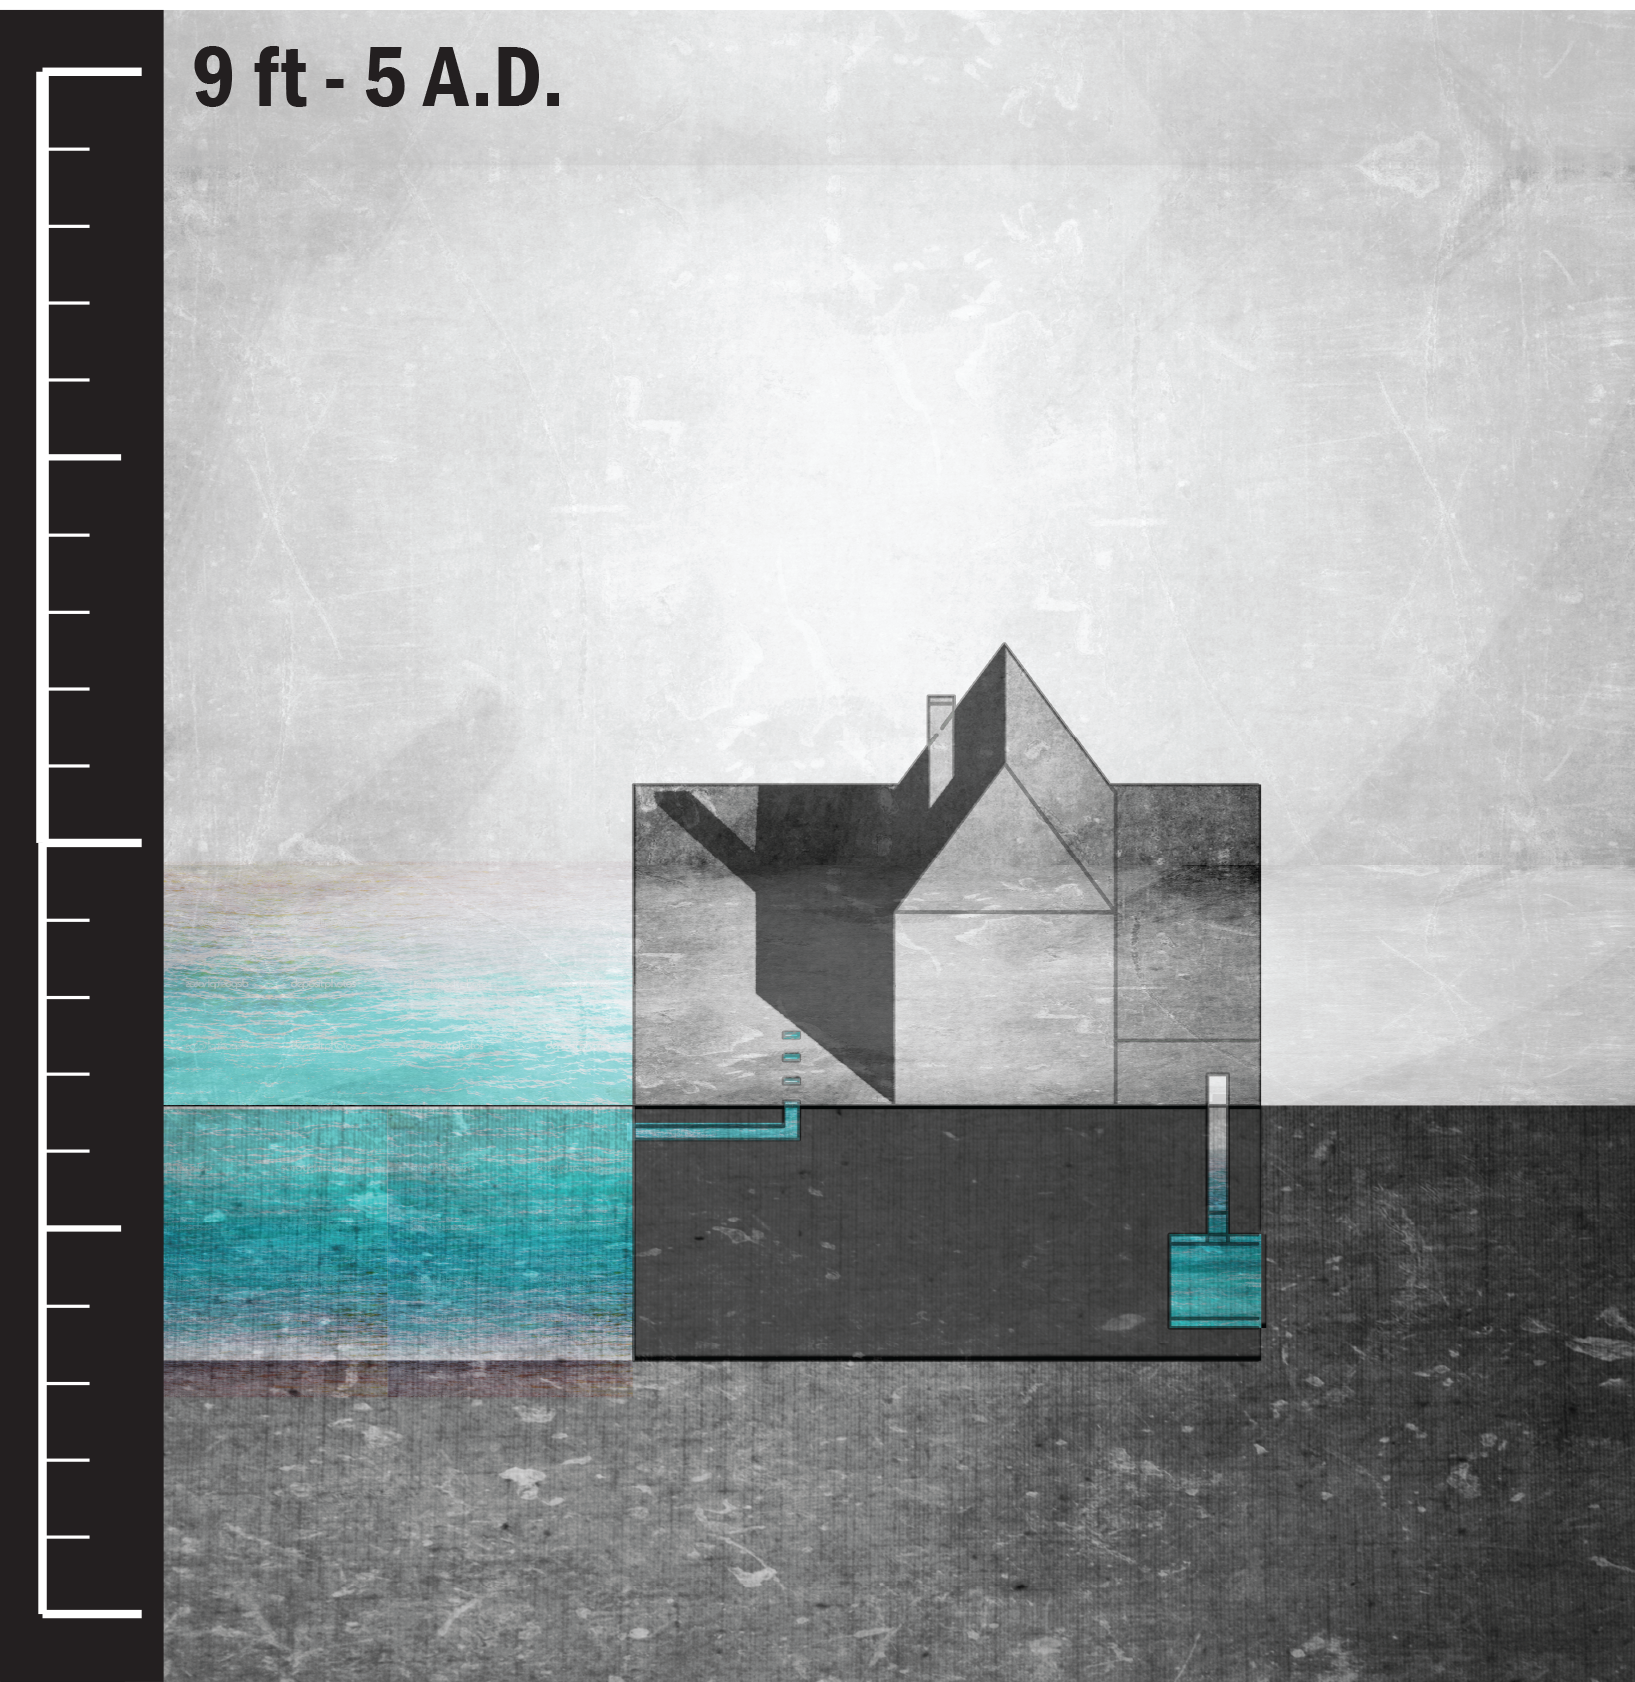
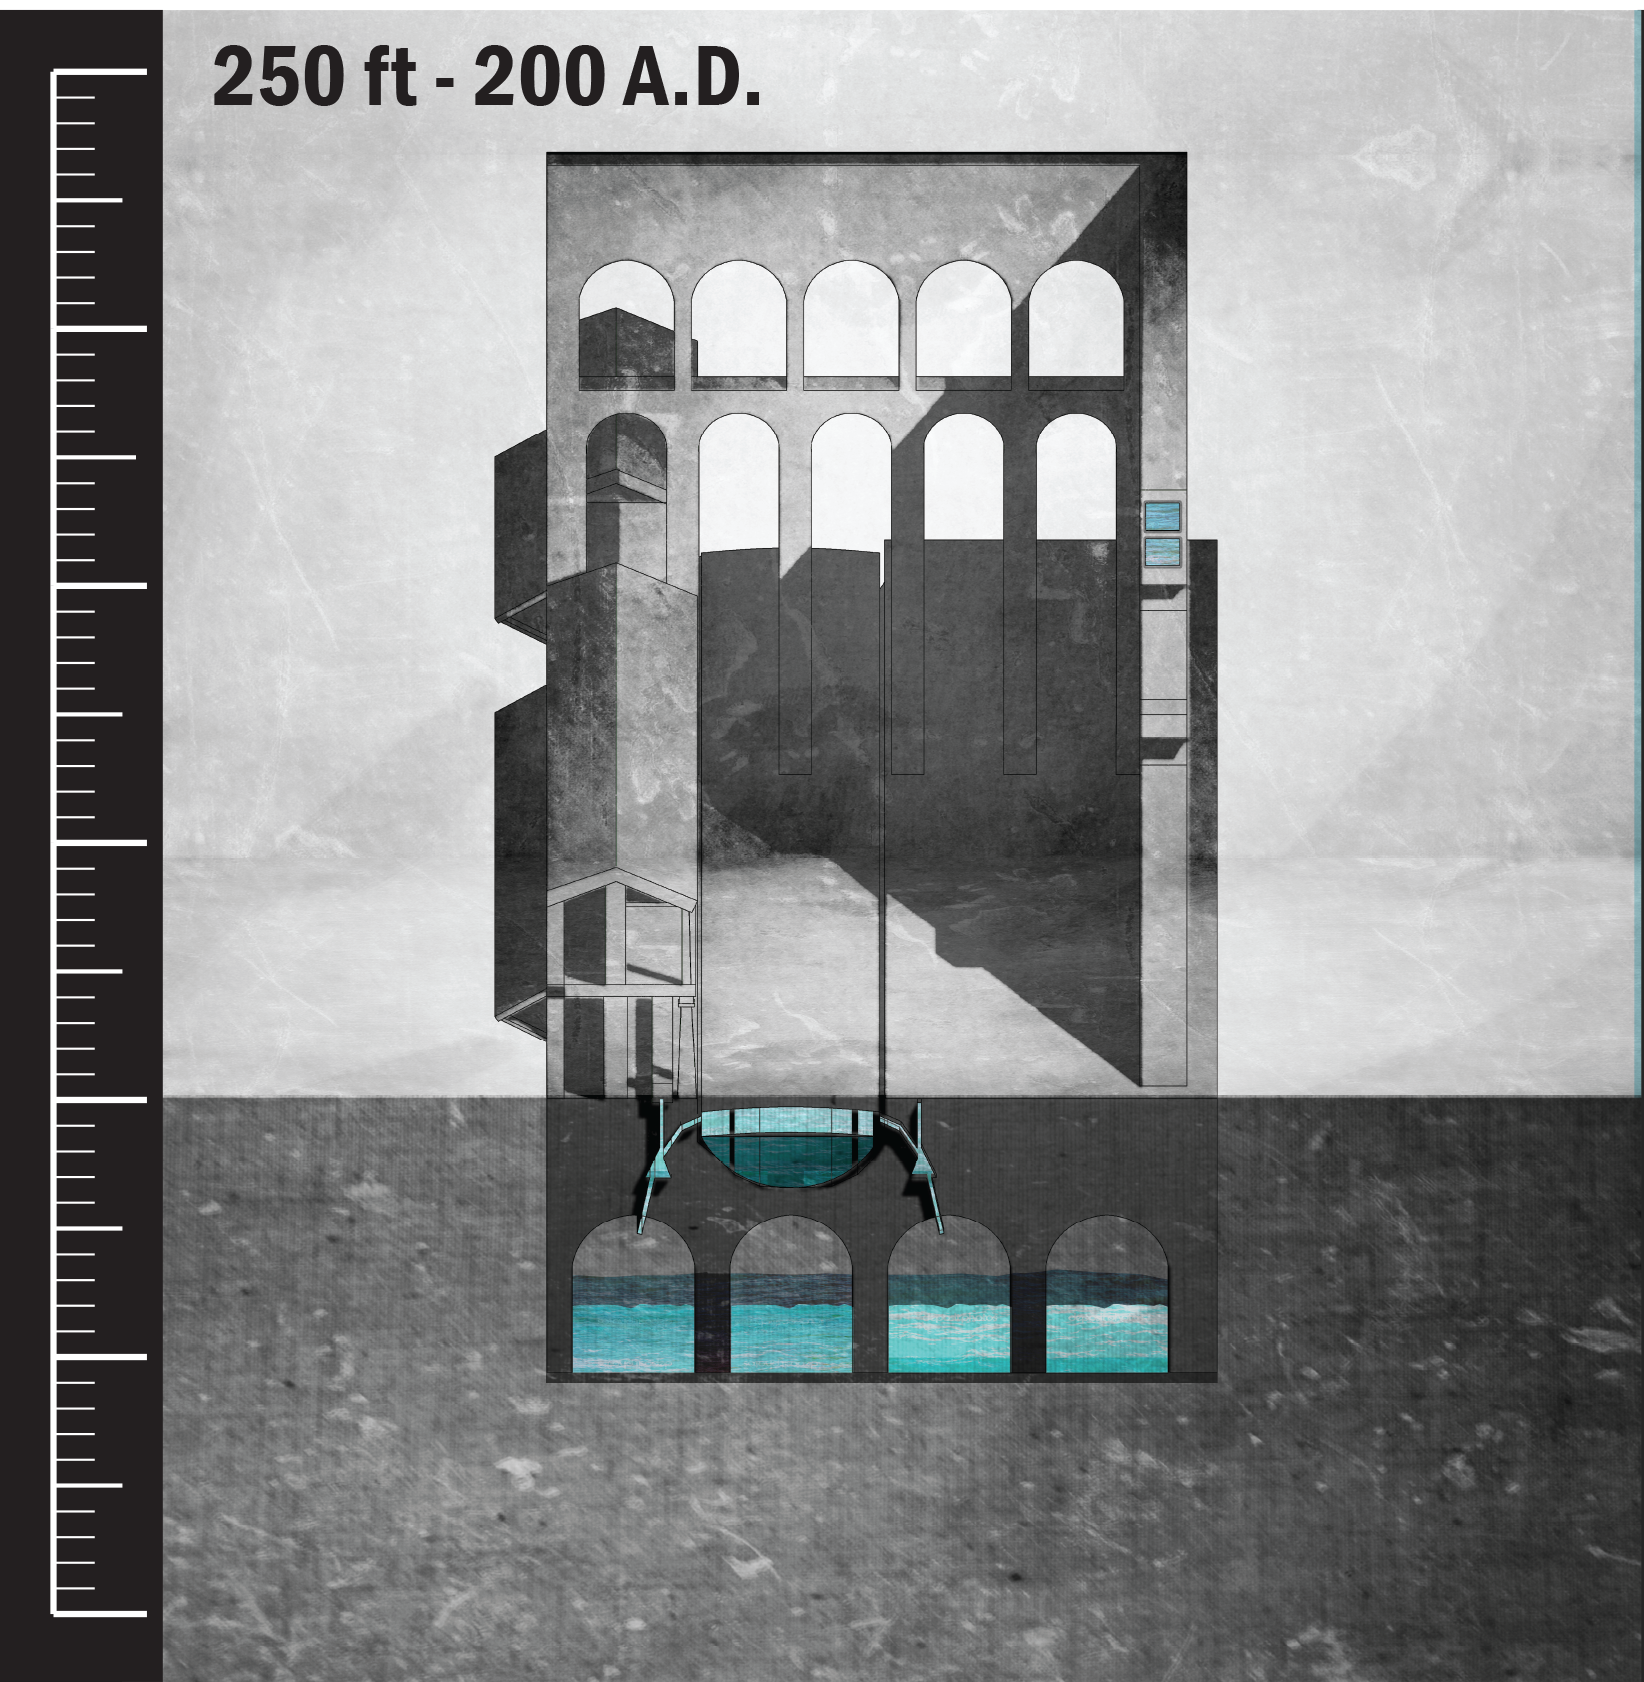
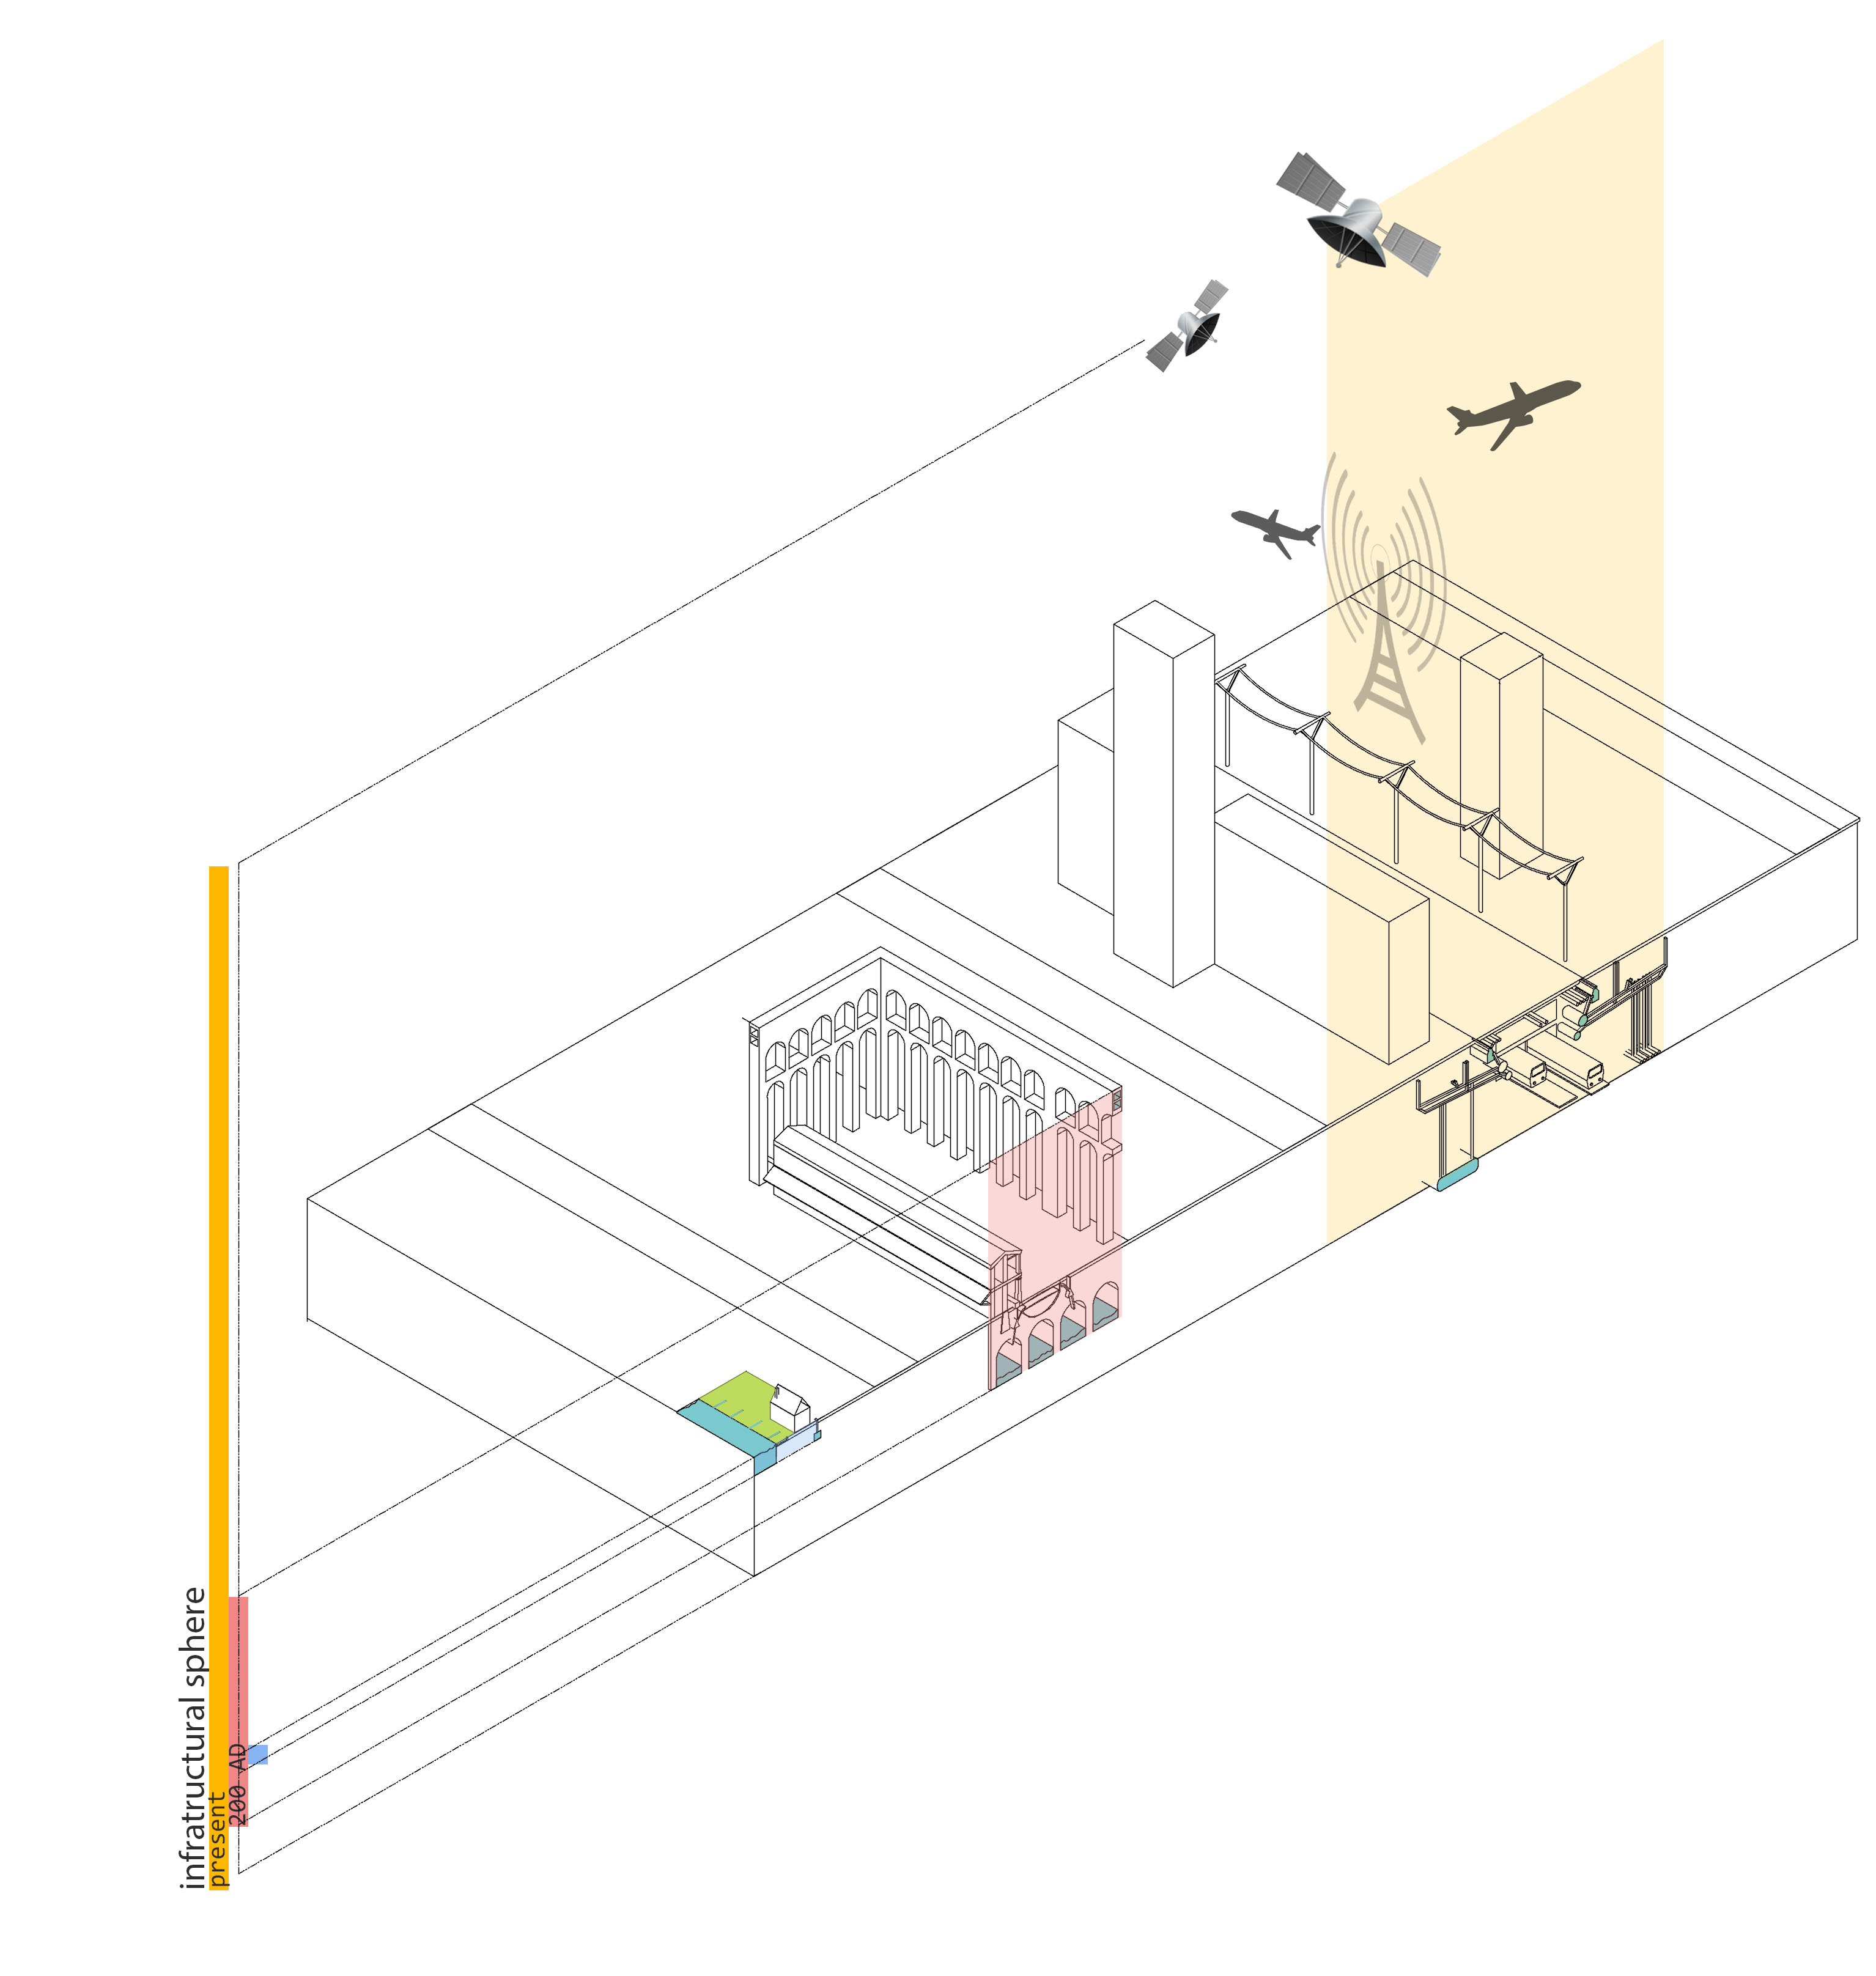
I use the term infrastructural spheres to refer to the collection of visible and invisible flow networks occupying space in 3D. Prior to the Romans, flow networks in the city were merely roads and channels dug at and close to ground level with negligible depth. Point sources in the form of wells and cisterns dug at greater depths infiltrated the networks, but overall, the infrastructure was planar rather than three dimensional. In the realm of the Roman Empire, the undertaking of the aqueduct system aggrandized the denotation of public infrastructure and exerted unprecedented impact on city life and public hygiene. Yet more relevantly, the aqueduct system demarcated the emergence of infrastructural spheres in Western cities. The profusion of aqueducts, coupled with sewage tunnels, distribution pipes, and castella reached 5 meters underground and up to 70 meters above ground1, inaugurating the infrastructural sphere of the Roman city. Two millennia later, infrastructural spheres have exponentially grown in complexity and scope, extending from tens of meters underground, to the Exosphere where satellites orbit ten thousand kilometers above ground.
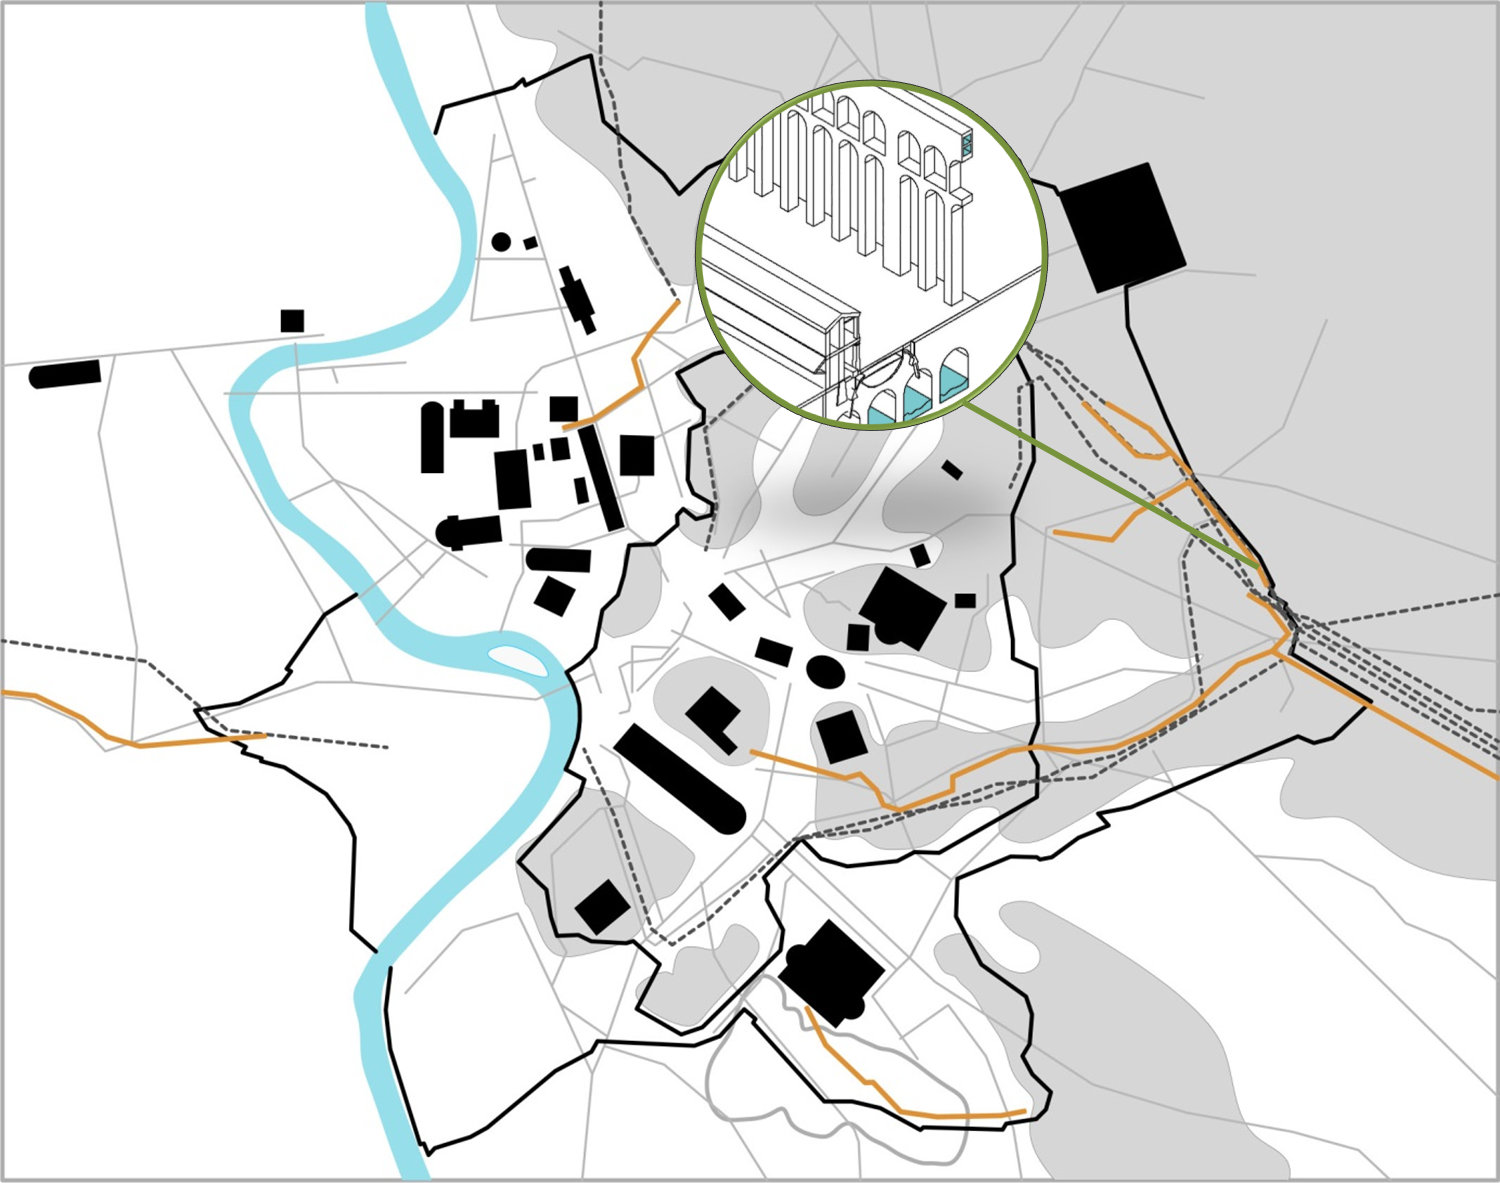
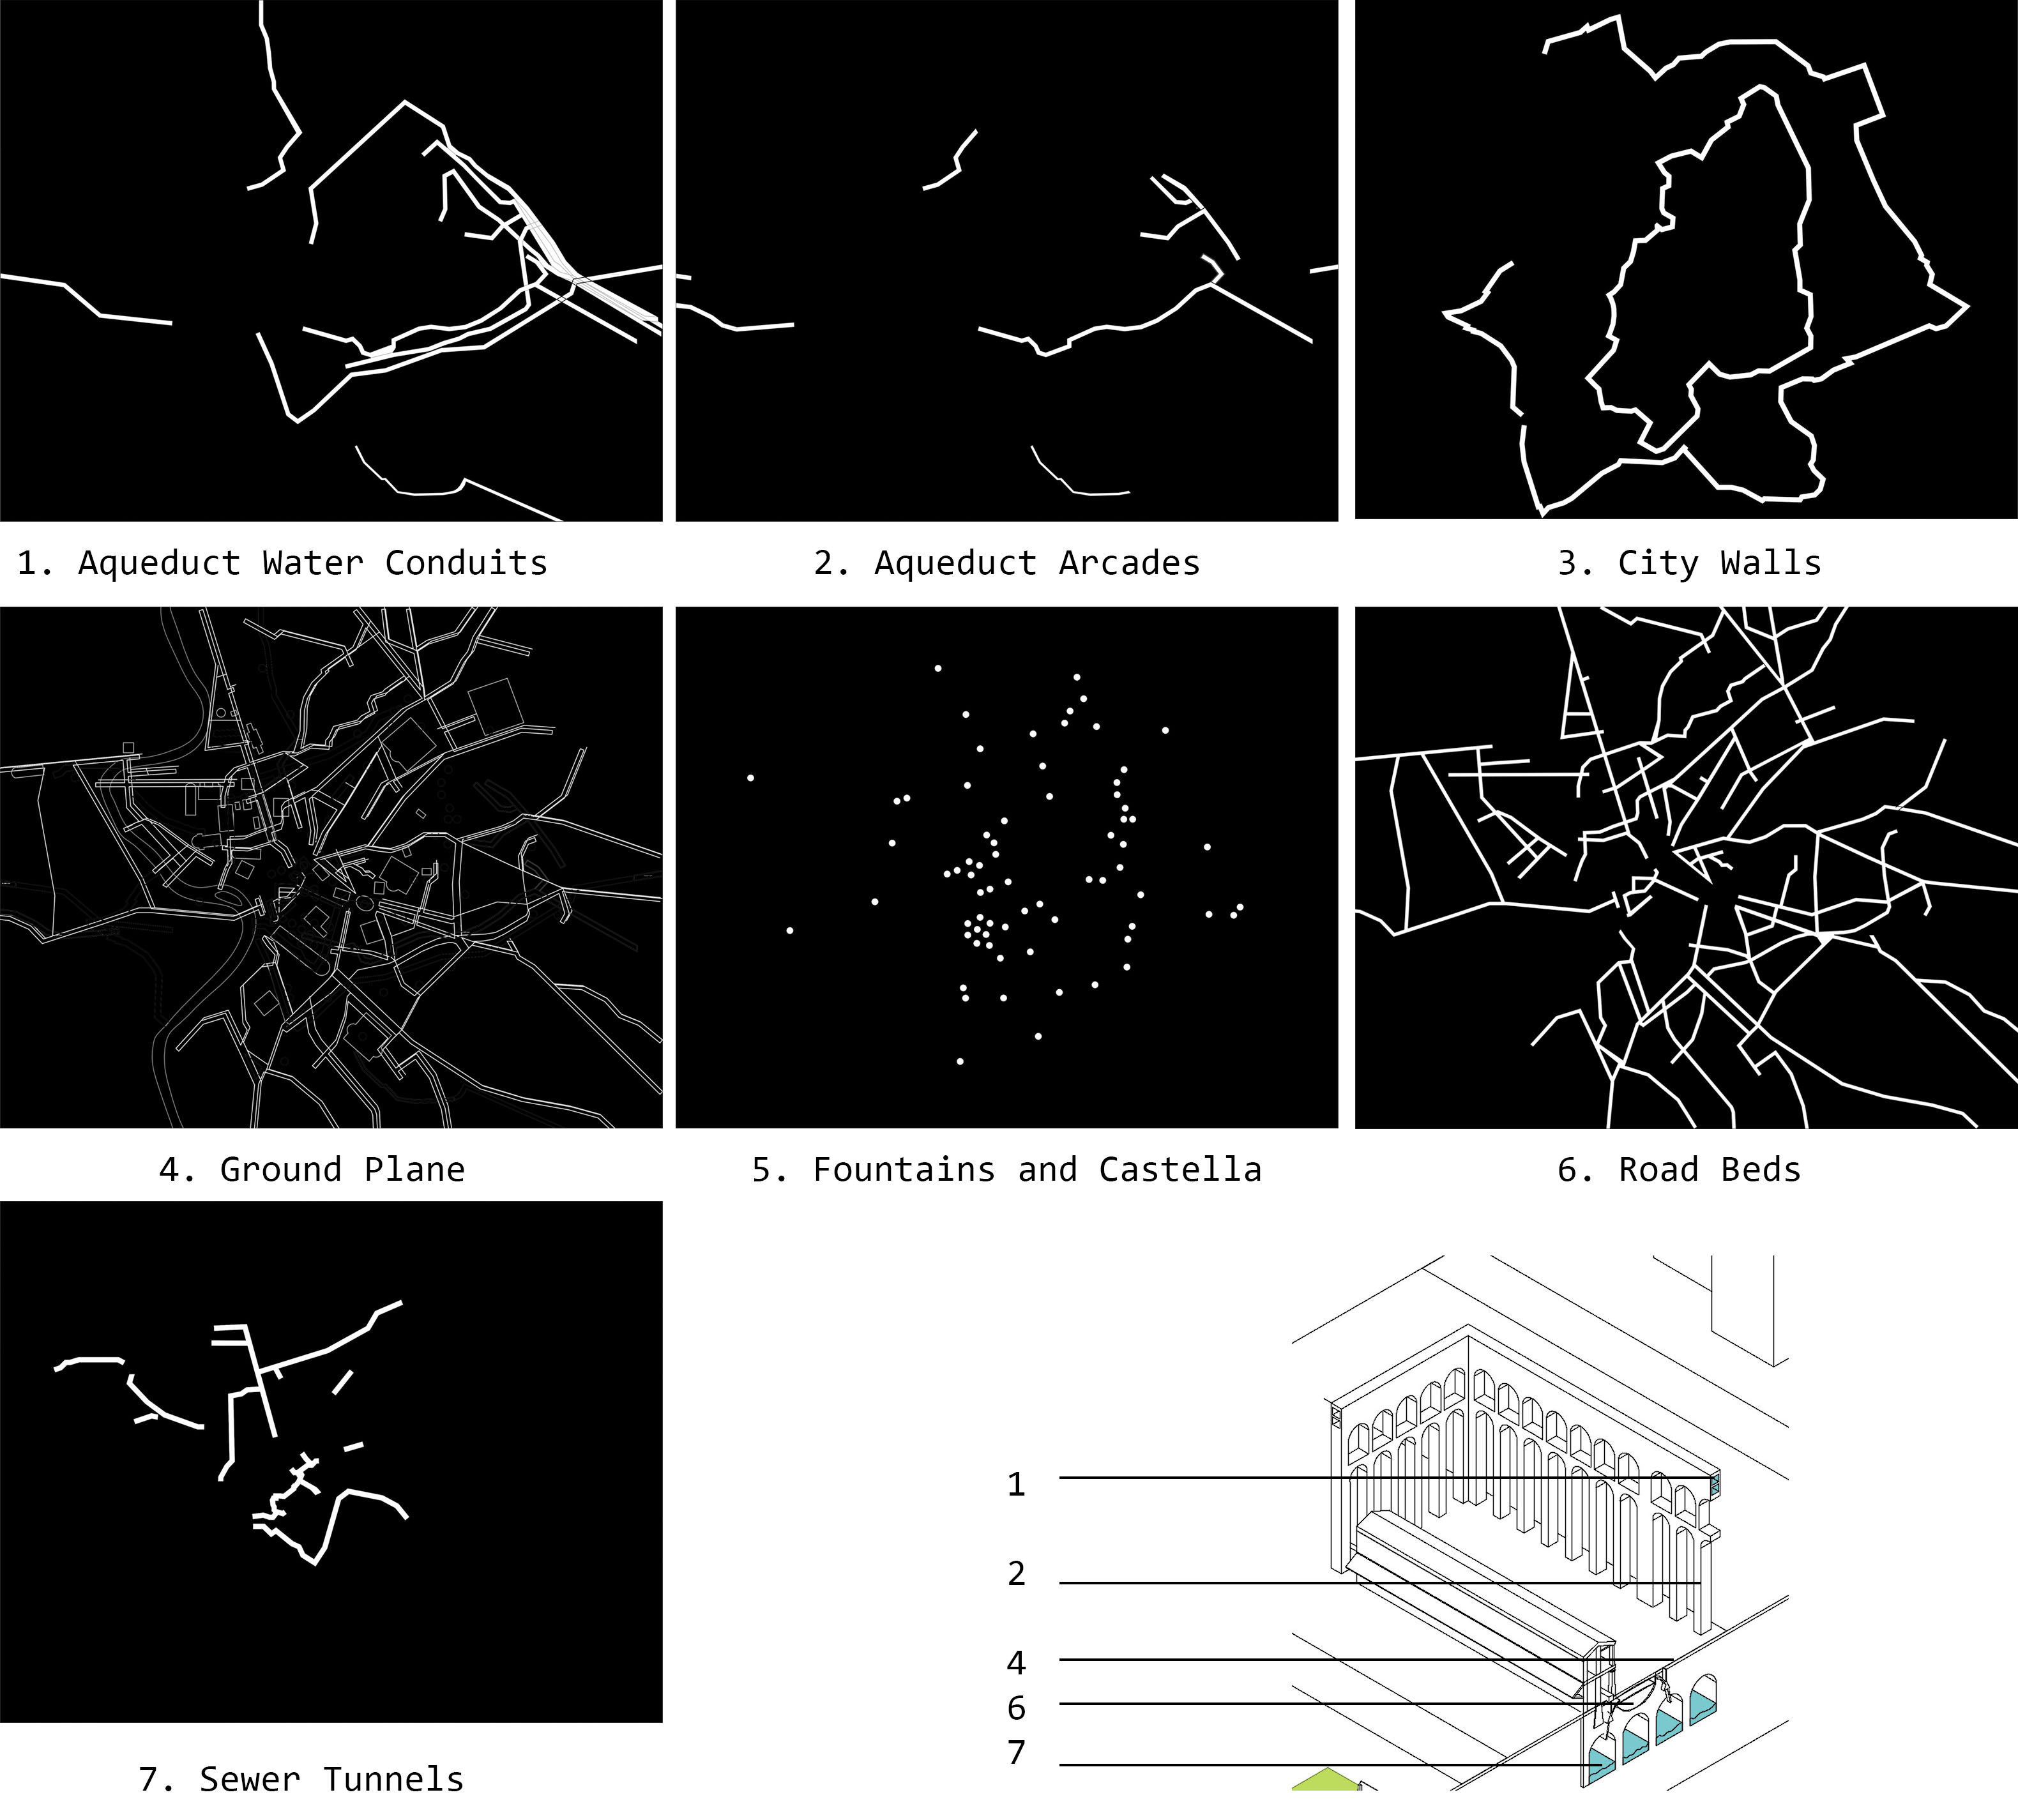
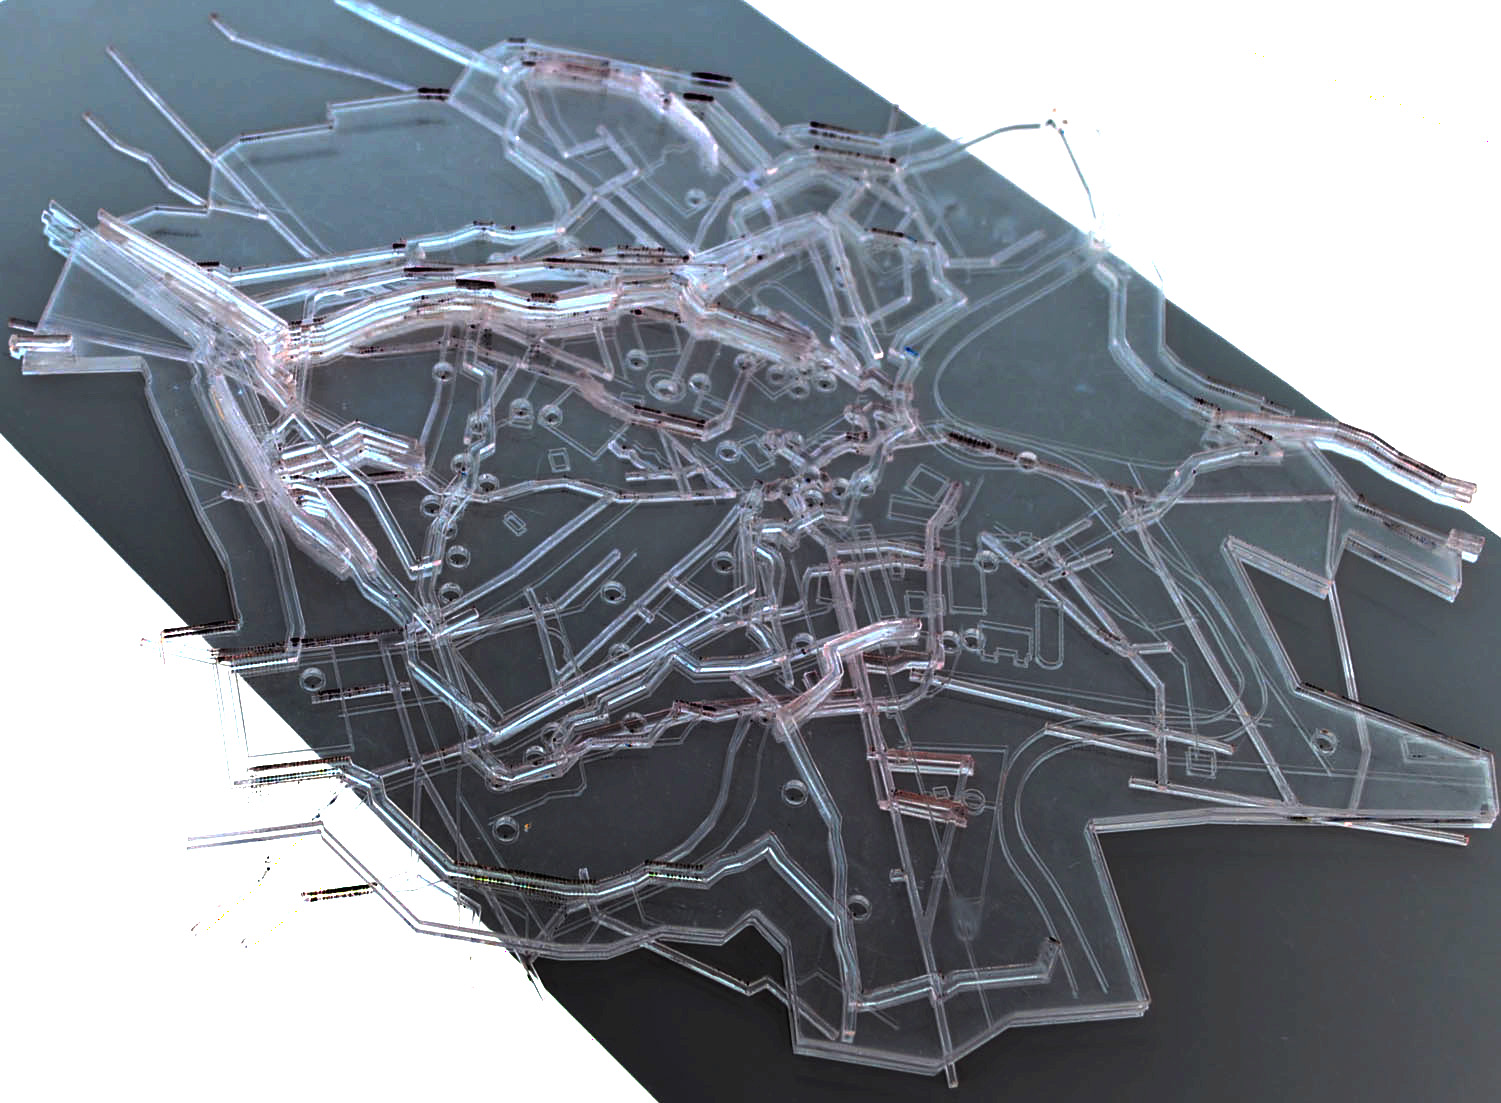
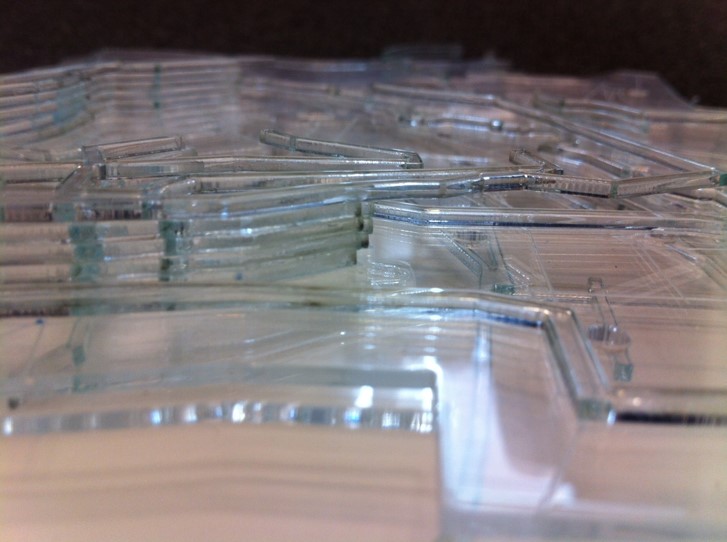
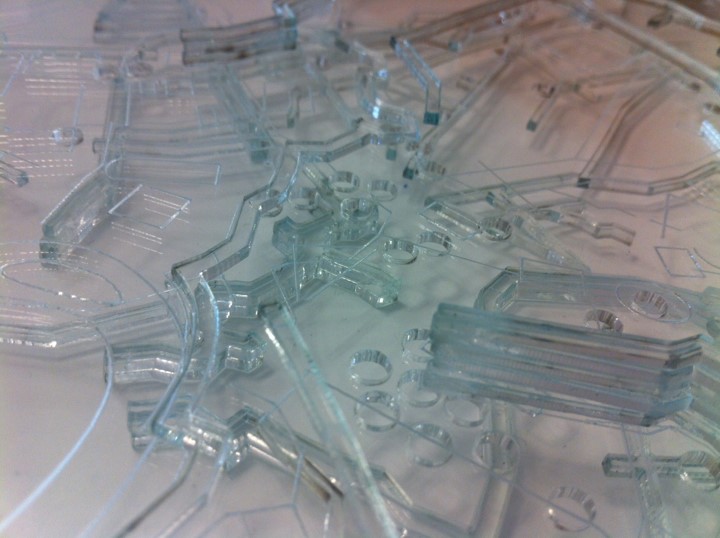
To capture such sphere, I propose an antithesis reading of the city, and show here one such reading of 200 AD Rome which favors the infrastructural sphere. This antithesis reduces buildings and topography to a single flat plane and is transparent to show the various layering of flow networks. To build the model, I traced the map pf ancient Rome in AutoCAD using sources such as the Frontinus’ record of the aqueducts in Rome, Samuel Platner’s maps of ancient Rome, and the University of Virginia Aquae Urbis Romae GIS system. I then extruded the aqueducts, conduits, fountains, castella, city walls, sewers, and road beds. This was followed by creating several horizontal section cuts through the aqueduct system, and the sewer channels, castella, and distribution pipes connected to it. The resulting layers were then laser cut on 1/16th inch clear plexi (figures 7 and 8). Some layers, particularly the aqueduct arcades and sewers were cut in multiples and stacked to emulate height variance. The highest point in the model is five stacked plexi sheets, depicting the Claudia and Anio Novus aqueducts which were 70 meters high. The model was built at the scale of 1:10000. The width of the various components was exaggerated by 25% for visual clarity.
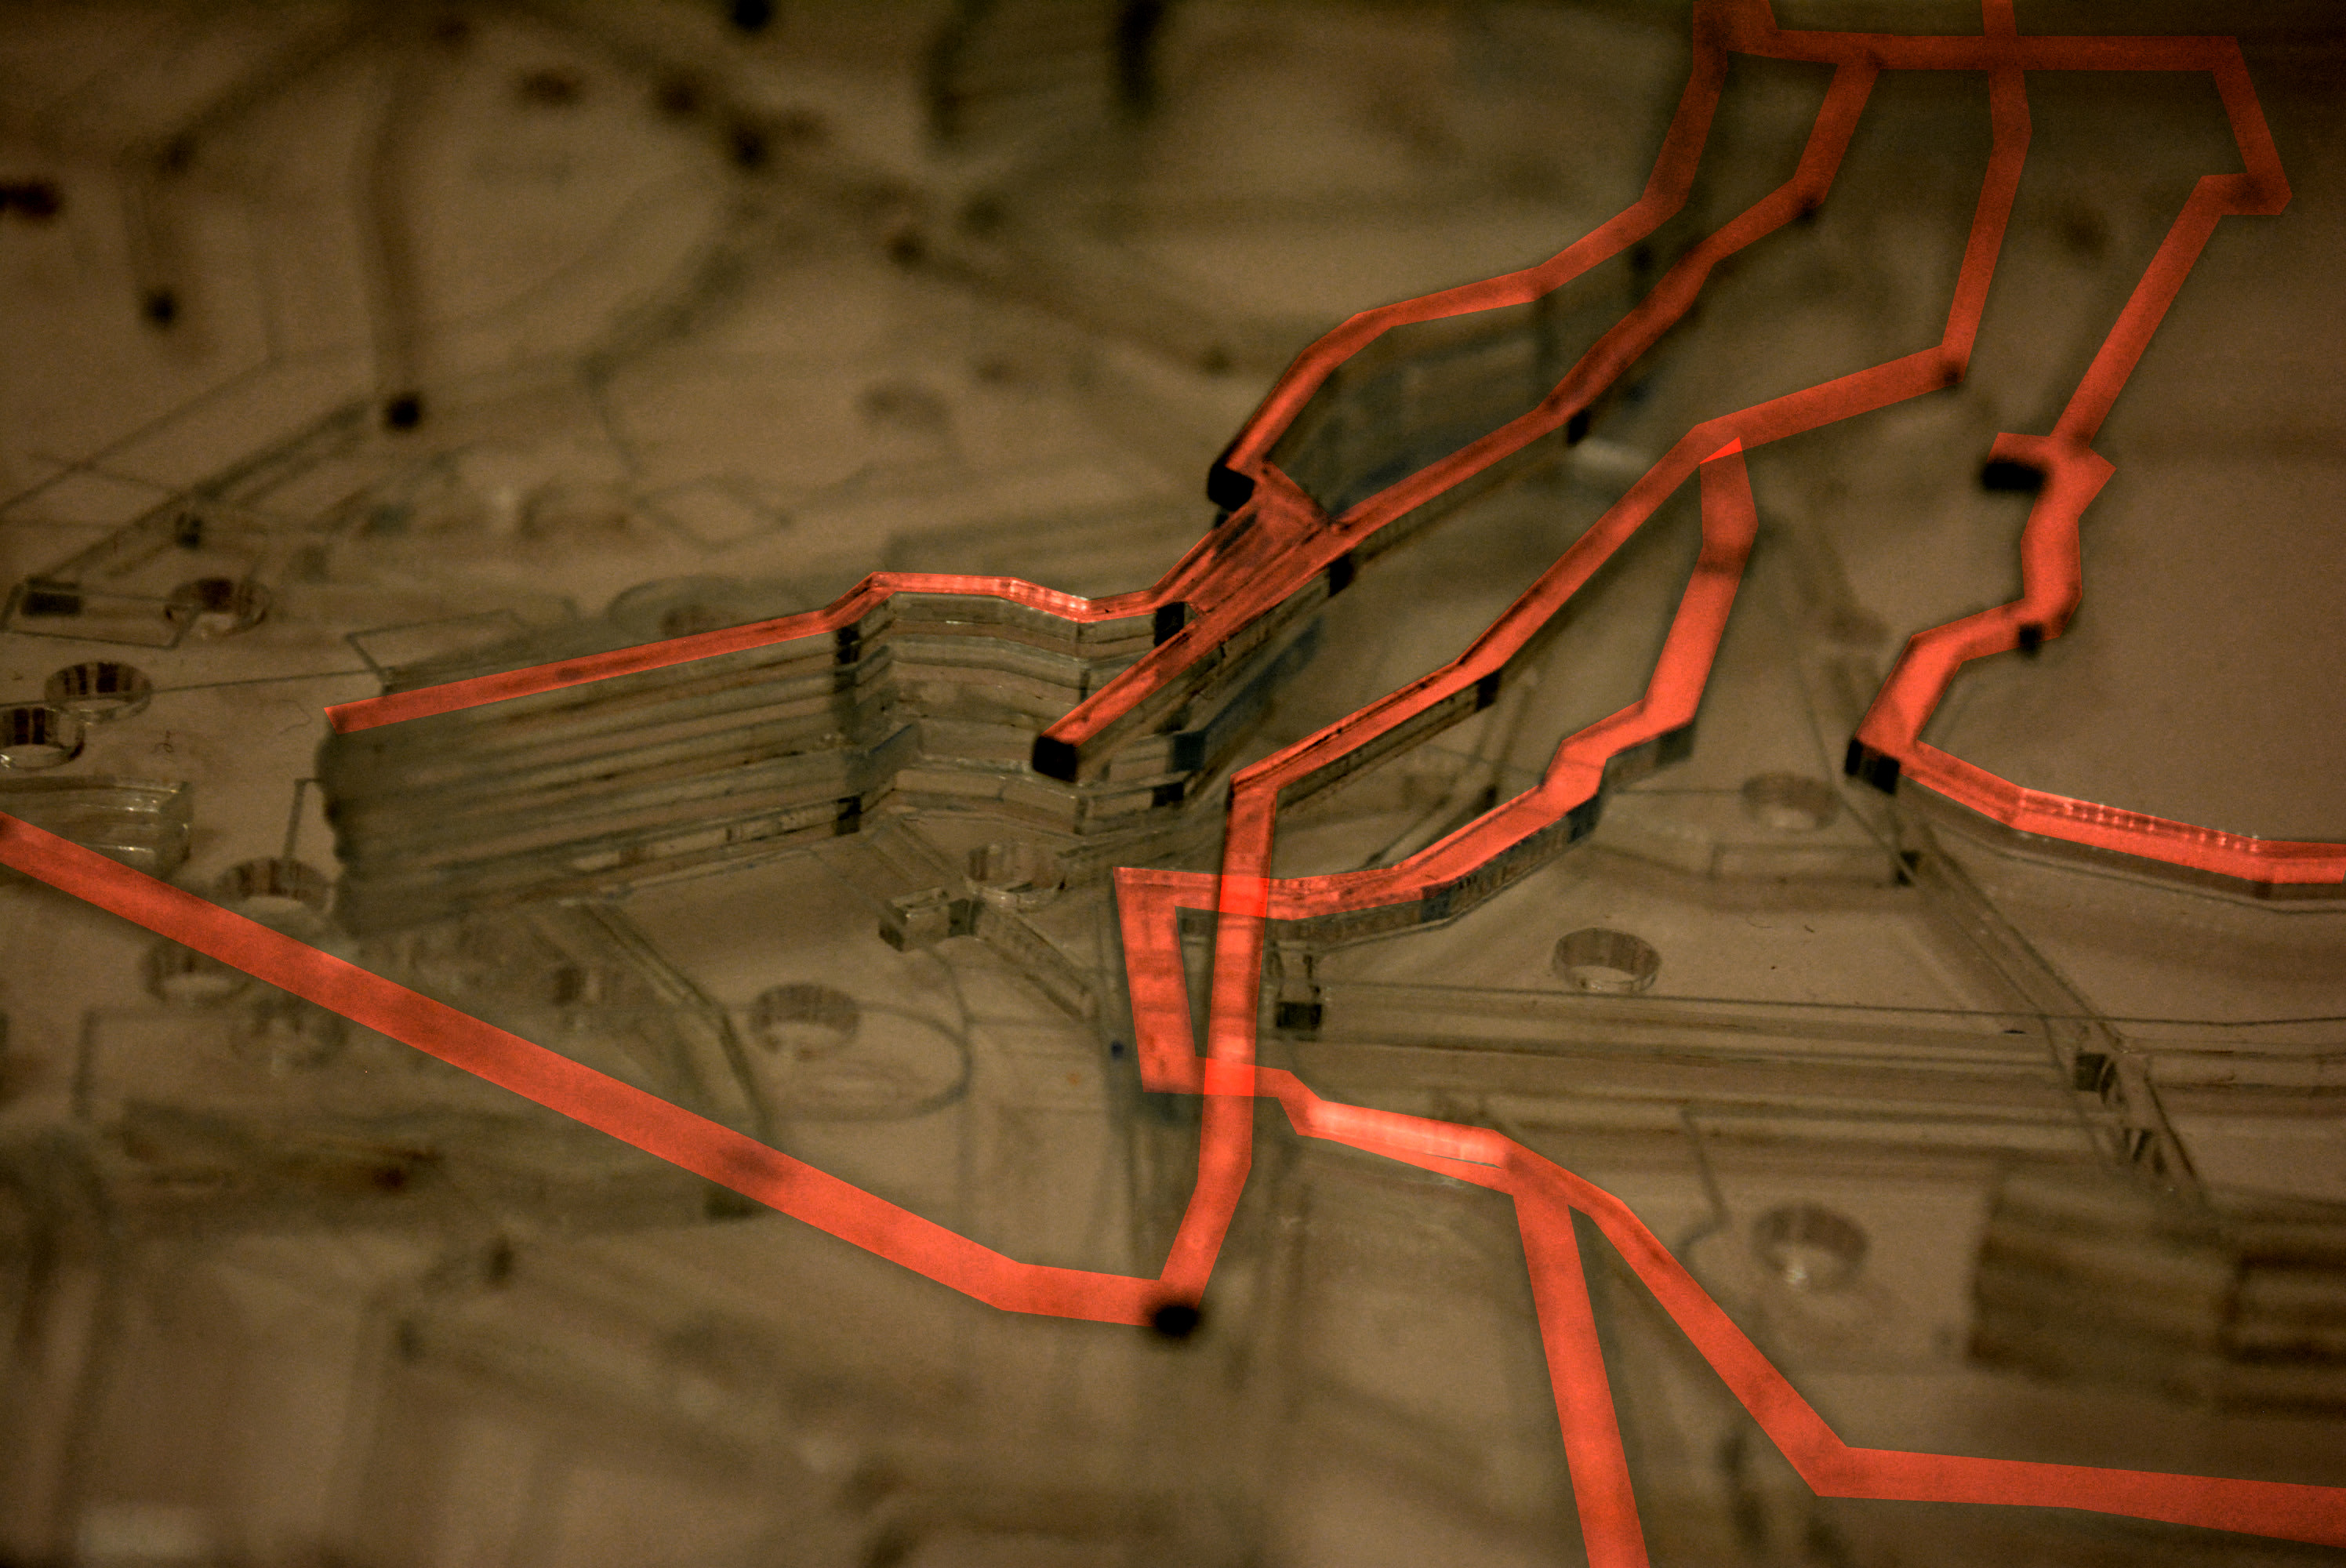
By analyzing the antithesis model and the process leading to it, several observations and conclusions regarding the Roman aqueduct system can be made. First, the model clearly portrays the emergent complexity and multi- layered nature of the infrastructural sphere it depicts, which is largely devoured by the map and model. Secondly, the various flow networks producing the infrastructural sphere appear as electric circuits (see figure 11) rather than a part of a city from antiquity. Interestingly, this analogy of the circuit is not totally preposterous. Circuits provide the power needed for the operation of machines just like the infrastructural sphere was the life vain for ancient Rome. Finally, the model depicts certain moments in Rome that are accurate yet appear physically impossible. For example, the point where the aqueduct arcade stops at the side of a hill while the water conduit continues through the hill. Because the hill is not modeled in the antithesis model, the conduit appears to float. Another moment is where city walls cut through the aqueduct arcades.
In second century Rome, the emergent infrastructural sphere consisted of water provision and sewage networks. In contemporary cities, the sphere has tremendously pushed its multitude and borderline to include the power grids, various water systems, communication fiber optics, subway tunnels, geothermal pipes, and the earth atmosphere. By omitting certain information and visualizing others in the antithesis model, we were able to generate new readings of the aqueducts and infrastructural sphere of ancient Rome. Since the complexity and multitude of the infrastructural sphere is proportional to the services it provides, imagine how many layers and components an antithesis model for today’s cities would have. Imagine what new and interesting readings it can convey about our cities. But even more importantly, imagine life in these cities the way conventional representational methods portray it: without the infrastructural sphere the antithesis model depicts.